Hi,
Before you read this post click on the below link for basic idea on how to use?
Power Pivot
Let us look at how to use Power Pivot for Microsoft Dynamics CRM..
Power Pivot is an add-in for Microsoft Excel which actually is very "Power" full in analyzing data with millions of records from multiple data sources into a single Excel workbook, build PivotTables and PivotCharts, and then further analyze the data so that you can make timely business decisions.
Before you read this post click on the below link for basic idea on how to use?
Power Pivot
Let us look at how to use Power Pivot for Microsoft Dynamics CRM..
- Install Power Pivot and Power Query before you start working with Excel.
- Once installation is done open excel you see the POWER PIVOT and POWER QUERY tabs as below.
- Click on POWER QUERY >> From Other Source>> From OData Feed
- Provide URL click 'OK' system will prompt you asking for credentials in 'Organizational account' click save.
- Navigator opens up asking to select Entity on which user want to create report. 'Select multiple' and select entities click 'Load'
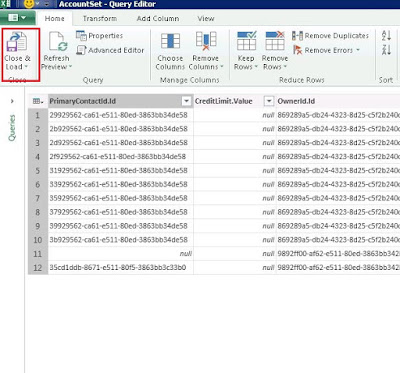
- Excel will load the DATA SET we can now select the fields required on the report by Right Clicking on DATASET >> Edit.
- Right click on AccountSet>>Load to. Data from Entity will be loaded on to Excel. Repeat same for OpportunitySet.
- Now Click on tab Design>> Power View.
- Select the required fields in logical way.
- Here I want to see the Account wise sum of Estimated Revenues.
- As soon as you add account form Account Entity and try adding Estimated Revenue system will ask you to provide relationship between Data sets.
- Once relationship is created excel will check for the Account related Opportunities and create a Table as shown below.
I am sure that user will love such reports!!!!
Cheers...


No comments:
Post a Comment